
XEOS shows excised tissue as PET and CT in a single image
Client: XEOS · Sector: Medtech
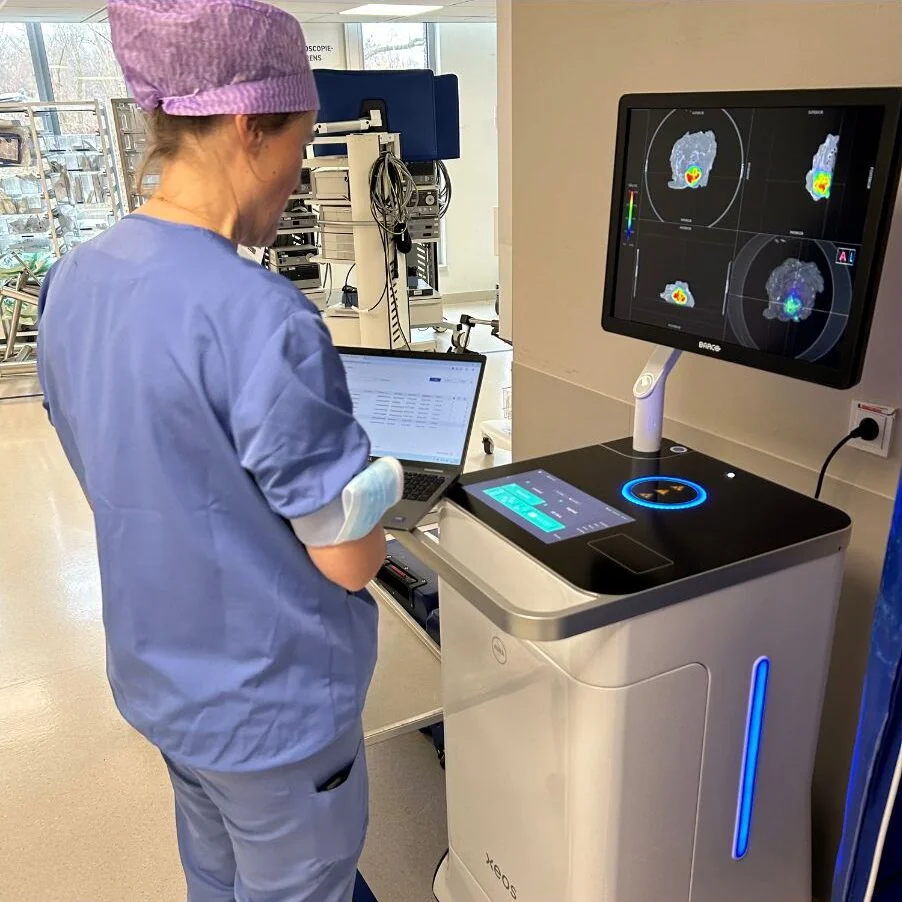
XEOS in Ghent builds the AURA 10, a PET-CT for the operating room. The excised tissue goes into the scanner. The CT captures the shape and density of that tissue, and the PET shows where the radioactive tracer has collected. The team wants to see both in the same image while they are still in the room.
That data comes as volumes, grids of voxels. A cross-section, a rotation or a PET layer on top of the CT all need someone to draw those grids. We built the frontend of that viewer, and the VTK integration that renders the volumes.
The result
Anatomy and tracer in one image. The CT and the PET of the same specimen share the same space, so you can see where the uptake sits in the tissue.
The volume can be explored. You scroll through cross-sections and rotate the 3D view, so the team can look at the specimen from several sides.
The viewer is part of the device. The images are reviewed on the system in the room, and the frontend is that screen.
What we built
Two volumes of the same specimen
The scanner delivers two datasets of the same piece of tissue. The CT is the grid of densities, and the PET is the grid of tracer uptake. In the viewer they stay in the same space, so a cross-section through the CT cuts through the PET at the same place.
VTK draws the volumes
VTK, the Visualization Toolkit, is built for exactly this kind of grid. A volume goes in and an image comes out: a plane through the data, or a 3D rendering. We connected that library to the viewer, so an action in the frontend requests a new image and VTK draws it.
The frontend
The frontend is the screen on the device. That is where you choose how the PET sits on top of the CT, which cross-section you see and how the 3D view is rotated. The pixels come from VTK, and we built the controls around them.